A widget used to visualize an undirected graph and draw it to a debug layer.
This widget implements the ice interface GraphVisualizerInterface and therefore can be provided with an undirected graph.
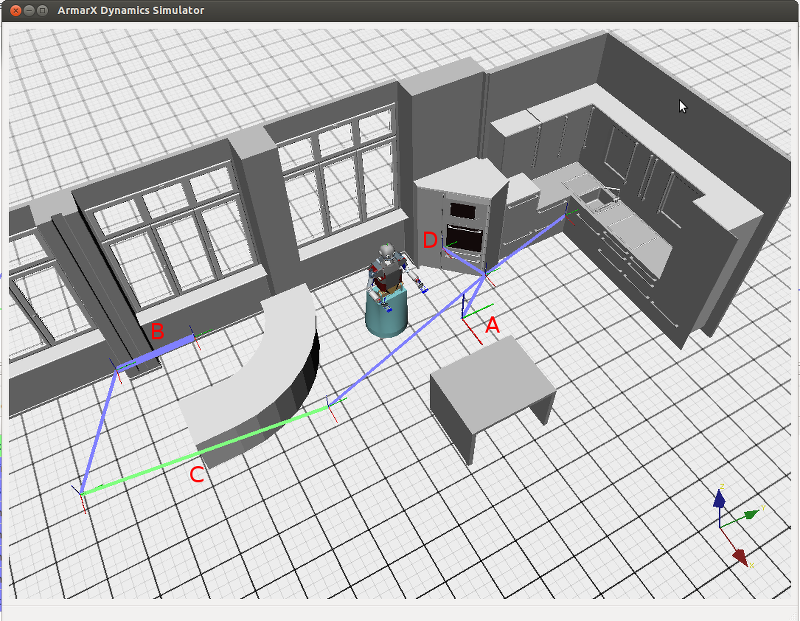
The graph is drawn to a debug layer and a scene located in the widget. The widget has tables containing information about the nodes and edges. Nodes on the debug layer are visualized as coordinate systems. Nodes on the scene are visualized as circles. Edges on the debug layer and scene are visualized with lines.
Nodes can be added with
and are identified with the string stored in p.
Edges can be added with
and are identified with {fst,snd}. fst and snd have to be the names of already existing nodes. The order of fst and snd does not matter.
The existence can be checked with the following methods:
All edges (the whole graph) can be deleted with:
If the graph has to be redrawn to the debug layer, use
Edges and nodes have four states: {selected, not selected}X{highlighted, not highlighted}
Selection affects the width of lines and the size of nodes. Selected lines are thicker and nodes have an increased size. Selection can be toggled by double clicking the element in the table or the scene.
Highlighting affects the color. If not highlighted, elements are blue. If highlighted, elements are green. (nodes drawn on a debug layer can't change color) The highlight can be set and cleared with the functions:
The graph used in the following examples can be created with the following code:

You can set the topic of the used debug drawer and the used debug layer.


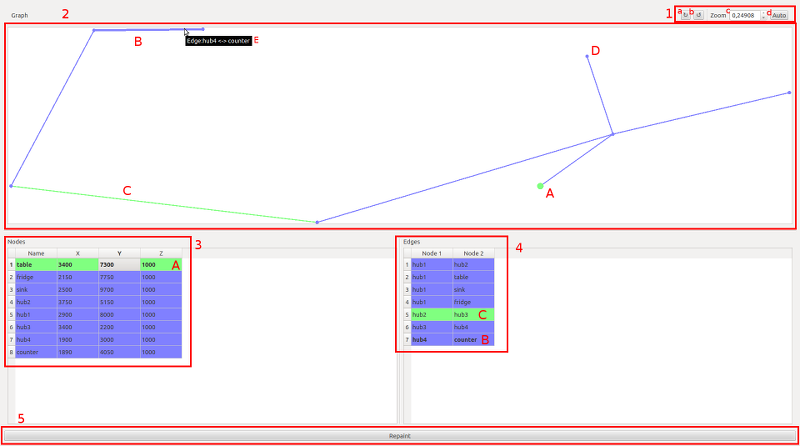
The ui has 5 sections
- Display options for the graph.
- a. Rotate the graph clockwise
- b. Rotate the graph counter clockwise
- c. Zoom factor for the graph
- d. Rotate and zoom the graph to display most of it. (The rotation is a multiple of pi/4)
- Is the scene containing the graph
- The table of nodes.
- The table of edges.
- Triggers a repaint for the debug layer.
- A) Shows a highlighted and selected node
- B) Shows a selected edge
- C) Shows a highlighted edge
- D) Shows a node. (no highlight or selection)
- E) Shows the tool tip of an edge.
- See also
- GraphVisualizerGuiPlugin
