Table of Contents
Introduction
This tutorial aims at providing a gentle introduction about how to log output data in the ArmarX framework. The documentation about logging can be found here: ArmarX Logging.
In ArmarX output messages are passed through the built-in logging features which can be considered as function printf() or std::cout(). Some of the main advantages coming with the logging utility can be summerized as:
- acting as std::cout
- storing meta data like file, line, time, who etc.
- offering several different log levels (from verbose to fatal)
- offering log backtraces
- providing logs over network (Ice)
- providing LogViewer (GUI) which works through Ice
- being thread safe
- providing console coloring.
In this tutorial we will implement a simple component that makes use of different logging features to better debug the components.
- Note
- Before getting started, it is strongly suggested to read the tutorial about Write a Server and Client Communicating via RPC (C++).
How to Log to Console
In order to log information to console, there are various macros available in ArmarX, each of which begins with "ARMARX_" and continues with a different extention, such as "INFO" or "DEBUG".
Firstly, we have to include the required .h file to be able to employ the logging macros
#include <ArmarXCore/core/logging/Logging.h>
In order to output a message to console, for instance, a simple text message we can use the following command
ARMARX_INFO_S << " Armar welcomes you! ";
This macro works like std::cout and anything that can be streamed into std::cout can be streamed to that macro. The *_S* stands for static. This means that this macro uses the static logging version. The non-static version is explained in the next subsection.
More logging control by inheriting from armarx::Logging
To gain more control about the logging, one can inherit from armarx::Logging. By doing this, some more features are available:
- controlling the log-level
- tagging
- spam reduction
- Setting the log-level of a class
- By calling the function armarx::Logging::setLocalMinimumLoggingLevel() the minimum logging level of this class is set for all following logging calls inside this class. This means, any logging calls with a log level below the set log level are discarded.
- Tagging the logging calls
- By using the function armarx::Logging::setTag() a tag for all subsequent logging calls in this class is set. This tag is shown in the console and GUI and can help filtering the logging data.
- Reducing logging spam
- If you have a loop or a periodically called thread you might send a lot of messages to the log. ArmarX offers a convenience feature to reduce such spam. In order to reduce the spam messages, i.e. to change how often the log data is output, we can employ the function called armarx::Logging::deactivateSpam() which requires deactivation duration in seconds as an argument. For example, the following line of code will output the log message in every 3 seconds:
ARMARX_INFO << deactivateSpam(3) << "This is a debug message";
Additionally, you can pass an identifier string to the function:for(int i = 0; i < container.size(); i++) ARMARX_INFO << deactivateSpam(3, i) << "This is a debug message with id " << i;This is useful if you want to print a line for each element of a container. By passing an identifier, on each call the last log-time for this identifier and this line is checked instead of just the line.
Log-levels
There exists different log-levels, each defines a unique message type. We now take a look at some samples of available log-levels.
- ARMARX_INFO: The normal logging level.
ARMARX_INFO << "The component is successfully initialized! ";
- ARMARX_DEBUG: The logging level for output that is only interesting while debugging.
ARMARX_DEBUG << "This is a debug message pushed in every " << 1 << " second ";
- ARMARX_VERBOSE: The logging level for verbose information.
ARMARX_VERBOSE << "This is a verbose message pushed in every " << 1 << " second ";
- ARMARX_WARNING: The logging level for unexpected behaviour, but not a serious problem.
ARMARX_WARNING << "Image dimensions are not defined! Default values will be used.";
- ARMARX_IMPORTANT: The logging level for important information. In contrast to ARMARX_WARNING, this considers the expected behaviour.
ARMARX_IMPORTANT << "Image size is more than expected";
- ARMARX_ERROR: The logging level for unexpected behaviour that must be fixed.
ARMARX_ERROR << "Image is not acquired! ";
- ARMARX_FATAL: The logging level for unexpected behaviour that will lead to a seriously functioning problem.
ARMARX_FATAL << "Camera is not responding and hence program exits ";
- Note
- Log-levels are defined in a hierarchy which defines the order that the log-levels are published. This order is as follows: ARMARX_DEBUG, ARMARX_VERBOSE, ARMARX_INFO, ARMARX_IMPORTANT, ARMARX_WARNING, ARMARX_ERROR, and ARMARX_FATAL.
How to Use LogViewer
The respective log messages can also be viusalized in ArmarXGui. In order to do that, we first start ice and ArmarXGui with the following commands
armarx start
armarx gui
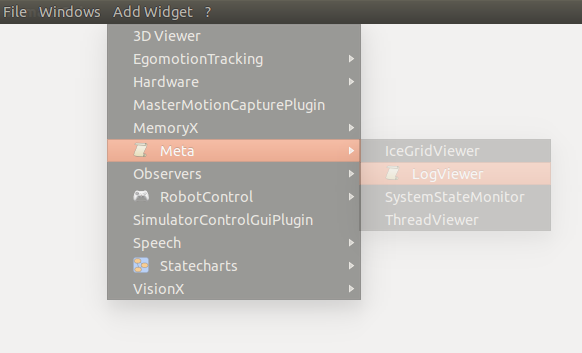
Next, we select "Add Widget" , "Meta" and then "LogViewer" in the drop down menu as shown here
The log viewer will visualize each log-level with some additional information such as message time and component type as shown below. It is also possible to filter out the logging data by considering the log level, i.e. macro type, or component that they are being published from. For this purpose we just need to select the respective log-level or component name that appears on the left bar under the section called "Filters" (see the image below). We can also select the global log-level by selecting any macro in the drop down menu that appears on the top-right part of the log viewer.

Log-levels in Scenario Configuration Files
The logging profile of any created application can easily be custimized using the scenario manager (ArmarX GUI -> Add Widget -> Meta -> ScenarioManager). Select the application you want to customize and edit the following properties.
The properties are separated in two sections. The first one defines the properties for the entire application, which are valid for all existing components in the application. The second section describes the properties only for one specific component.
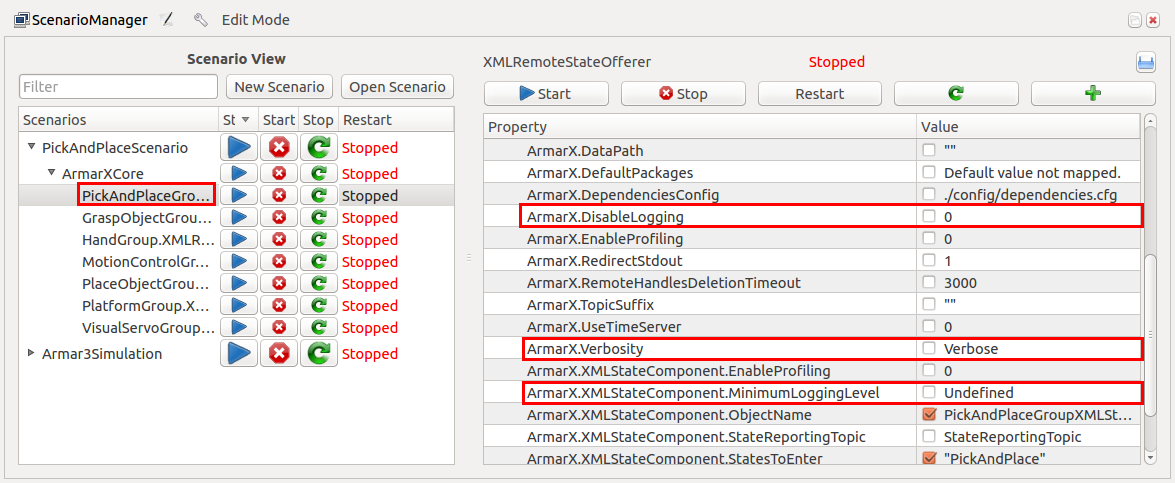
If we take a look at any configuration, e.g. the screenshot above, we first see the following highlighted properties
Here, the first property enables or disables the logging feature in the entire application. Note that by default it is set to 0, i.e. logging feature is enabled.
The second property describes the global logging level for the entire application with some default values. By default, the verbosity feature is set to Verbose, which means all log-levels after ARMARX_VERBOSE in the hierarchy will be published and the rest, in this case only ARMARX_DEBUG, will be ignored. We can easily alter the verbosity level, for instance, to ARMARX_DEBUG as
The next property deals with the logging level of only this specific component. By editing it we can locally alter the minimum logging level in the component. The default logging value here is set to "Undefined". This will yield the observation of existing log levels in the hierarchy.
Debug Observer
Logging the frequently updated data to console will keep the console busy and also lead to untrackable data flow. To tackle this problem we can make use of the debug observer in our components that require the tracking of heavily updated parameters. The debug observer provides temporary observer channels each can easily be viewed with ObserverGuiPlugin in the ArmarXGui. Note that to be able to use this debug observation functionality we need to separately start the debug observer component.
A sample code given below will be now used to explain the basic functionalities of the debug observer. Here, our component, so-called "LoggingExampleComponent", has a periodic task which runs as a separate thread and calls back the method "run()" in every 10 msec. Lets assume that we would like to track some values of our data that is computed inside this run() function. Here, we have two dummy variables, "counter" and "position", each is first set to zero and then incremented in every callback.
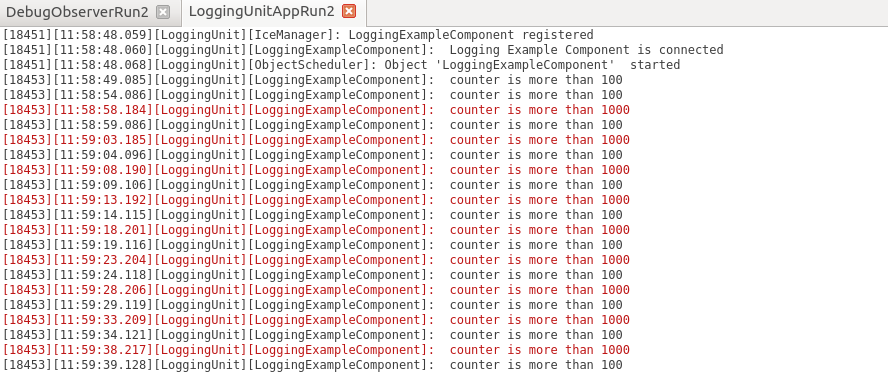
As mentioned before, we can log these variables to console. The first block of code in the method run() is basically doing that. We here use ARMARX_WARNING and ARMARX_ERROR macros to output the counter and position values in every 5 seconds by calling the deactivateSpam().
    if (counter > 100)
        ARMARX_WARNING << deactivateSpam(5) << " counter is more than 100" ;

    if (counter > 1000)
        ARMARX_ERROR << deactivateSpam(5) << " counter is more than 1000" ;
This method will however keep the console busy as shown below. Note that ARMARX_ERROR logs are printed in red.
Instead of polluting the console, we can benefit from the debug observer. In order to do that, we first connect to the DebugObserver using the proxy (see onInitComponent() and onConnectComponent()). Now, inside the run() function, we set a separate debug data channel for each variable as shown in the second block of code (see also below). Here, we use the member function setDebugDatafield() that creates or updates (if it already exists) a datafield in a channel. For instance, we have pass the counter values to the counterChannel by naming the data field as "counter". Note that variant templates provide a mechanism to store several types of data in one construct and send them via ice. The Variant class offers a unified interface for storing and accessing values of several data types.
// logging to debug observed using separate channels
debugObserver->setDebugDatafield("counterChannel","counter", new Variant(counter));
debugObserver->setDebugDatafield("positionChannel","position", new Variant(position));
To observe the debugged values, we have to separately execute the debug observer component. For this, you can run the DebugObserverRun executable exits under /armarx/ArmarXCore/build/bin as
/armarx/ArmarXCore/build/bin$ ./DebugObserverRun
We start the application of our example component as
/armarx/ArmarXCore/build/bin$ ./LoggingUnitAppRun
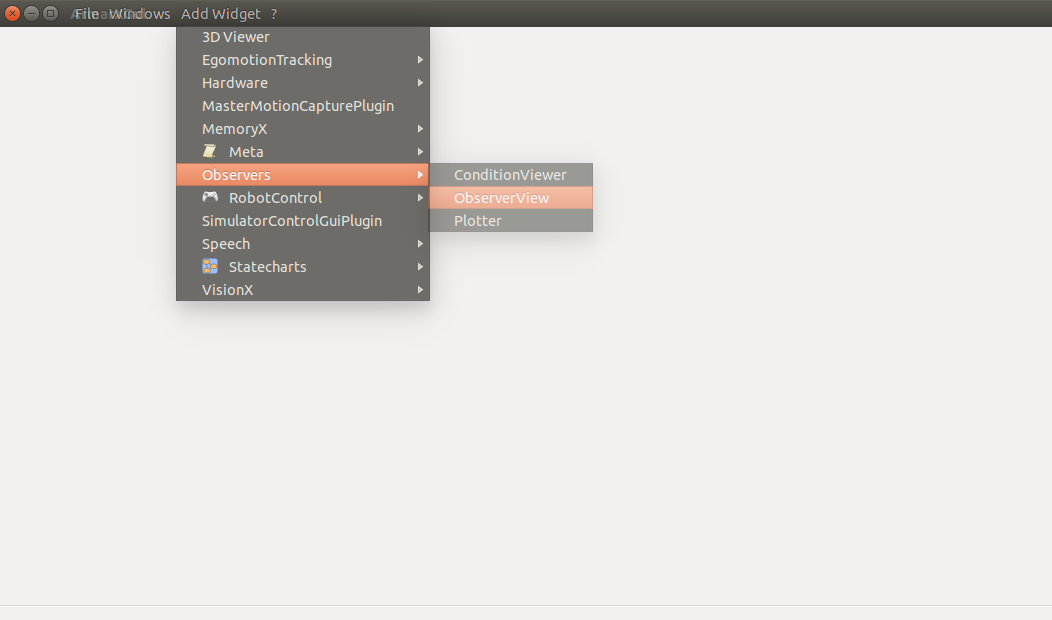
Then we start ArmarXGui and open ObserverView plugin as shown here.
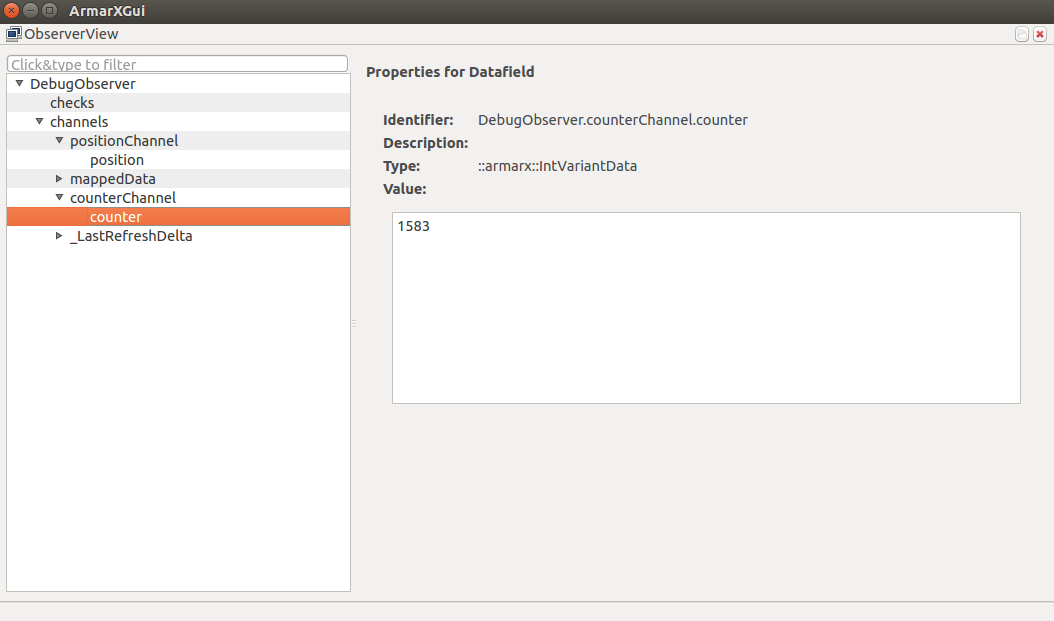
Now, we can see each individual channel separately if we click on the drop-drow menu of DebugObserver as shown below. Here in this snapshot (see below) the value of the counter in the counterChannel is observed as 1583. We can easily select other variables in different channels by simply clicking on them in the same drop-down menu appears on the left.
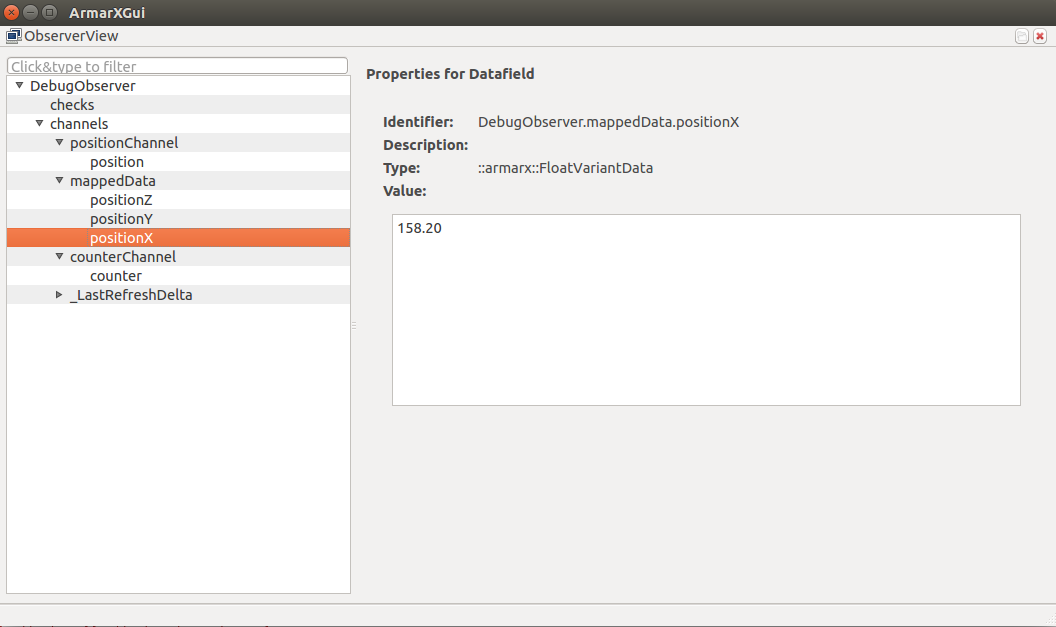
Instead of pushing each variable to a unique channel, we can also employ the setDebugChannel() method that can track mapped data. As seen in the last code block in the run() function (see below), we stored the dummy position value as different keys in a map. We then push this map in to a debug channel so-called "mappedData."
// logging to debug observed via single channel using the map
mapValues["positionX"] = new Variant(position);
mapValues["positionY"] = new Variant(position*2);
mapValues["positionZ"] = new Variant(position/5.0);
debugObserver->setDebugChannel("mappedData", mapValues);
In the case of selecting the channel of mappedData in the debug observer, we can see the values of each key elements separately as shown below.
Debug Plotter
We can also plot the logged data online. Debug plotter is designed for this purpose. Lets assume that we would like to plot the counter values while the program is running. For this purpose we first start the Plotter plugin in ArmarxGui as shown here

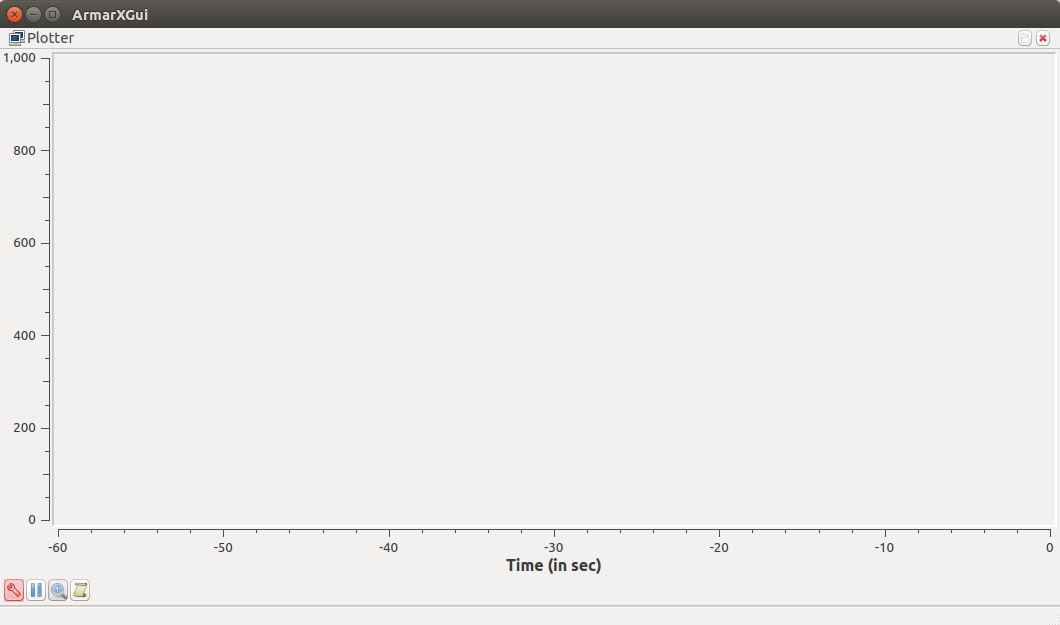
This option will provide an empty plot window as shown here. We can simply click on the tiny tools icon (highlighted in red) that is the first button in the bottom-left side of the window.
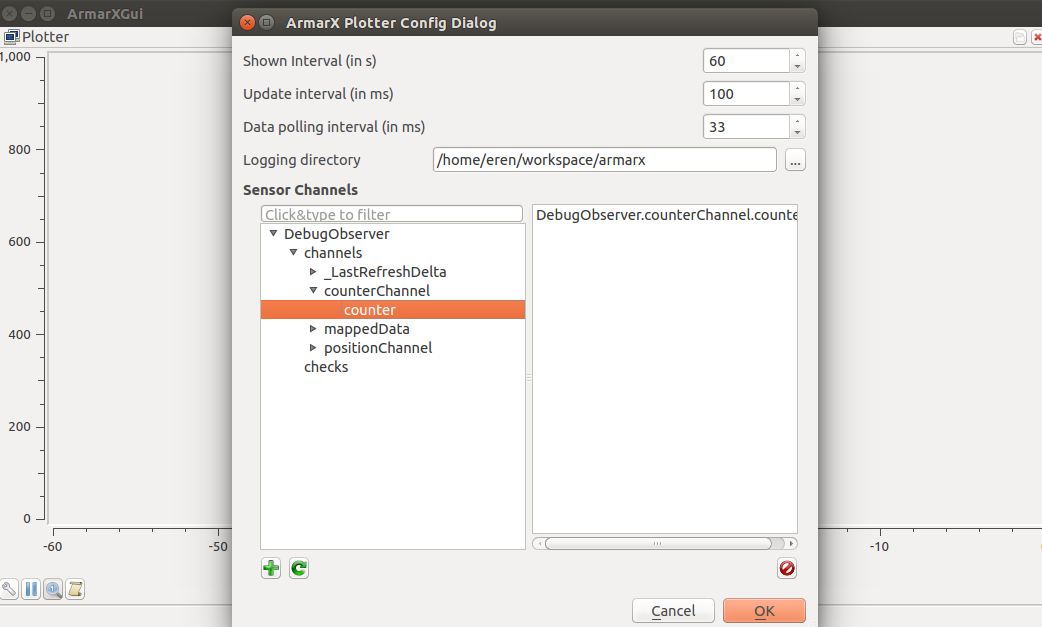
This icon will open the ArmarX Plotter Config Dialog as shown below. As we did before, we can here select any variable (even two or more) by simply double clicking on the respective variable name. As shown below we select the counter variable existing in the counter channel.
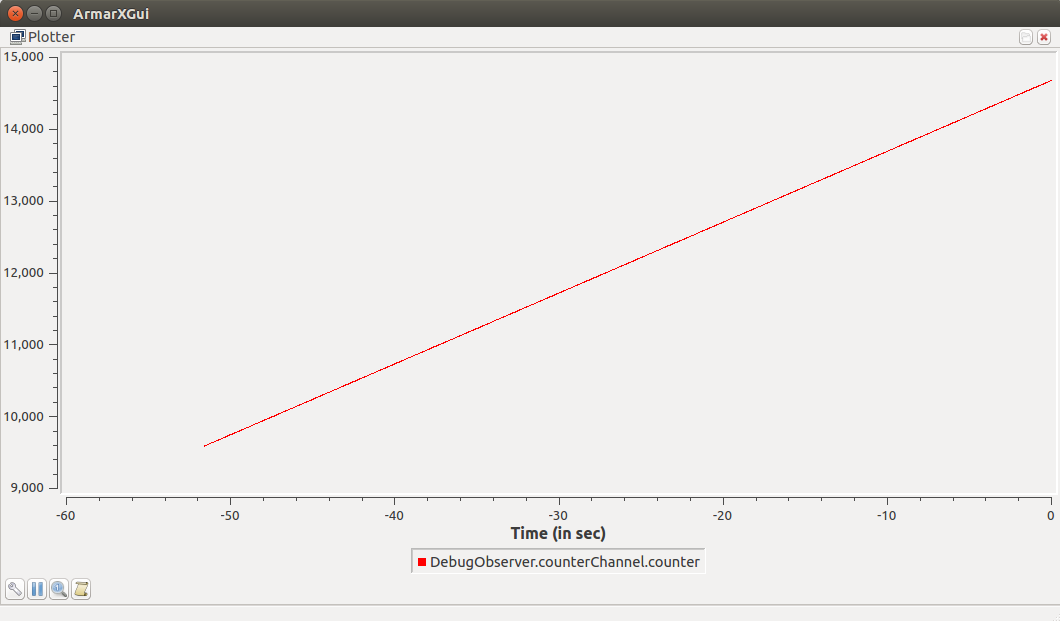
This will lead to the final plot of our currently updated data. In order to be able to better see the plot, we should click on the magnifier icon in the bottom-left side of the window. This button will fit the plot to the axes for a better visualization. As shown below, since the counter is incremented at each callback, we get a nice linear red line as a final plot. Note that at each call, this plot will be updated automatically. We can stop the plot or let it run again by simply clicking on the stop icon. We can choose multiple data to plot.